Full-stack monitoring,
from API to kernel.
Sysmos gives small teams a single pane of glass for distributed API health checks and kernel-level server observability — without the enterprise price tag.
Three products. One platform.
From the public-facing API your customers hit to the kernel call deep inside your VM — Sysmos covers the full stack so you stop juggling tools.
Distributed health checks, instantly verified
Run synthetic checks from multiple global regions on every endpoint — get latency, status, SSL, and timing breakdowns in real time.
Kernel-level visibility, without the noise
A lightweight eBPF-powered agent captures syscalls, network, CPU, and memory data with under 2% overhead. Drop-in for Linux servers.
Explore→One pane of glass for everything
Monitors, flows, alerts, team, plan — all in one workspace. Designed for small teams to share context and respond fast.
From signup to first alert in under 5 minutes.
No SDK to wire up, no agents to compile. Add an endpoint, install the agent with one line, route alerts where your team already lives.
Add an API endpoint
Paste a URL, pick the regions you care about, and set an interval. SSL and status validation are on by default.
Install the agent
One curl command on each Linux host. The eBPF agent starts streaming kernel-level metrics within seconds.
Route alerts to your channels
Connect Slack, Discord, PagerDuty, custom webhooks, or email. Same provider can fan-out to multiple channels by severity.
Built for the teams shipping production code at 2am.
Sysmos is the monitoring tool we wished existed when we were on-call: fast to set up, calm to look at, honest about what it knows.
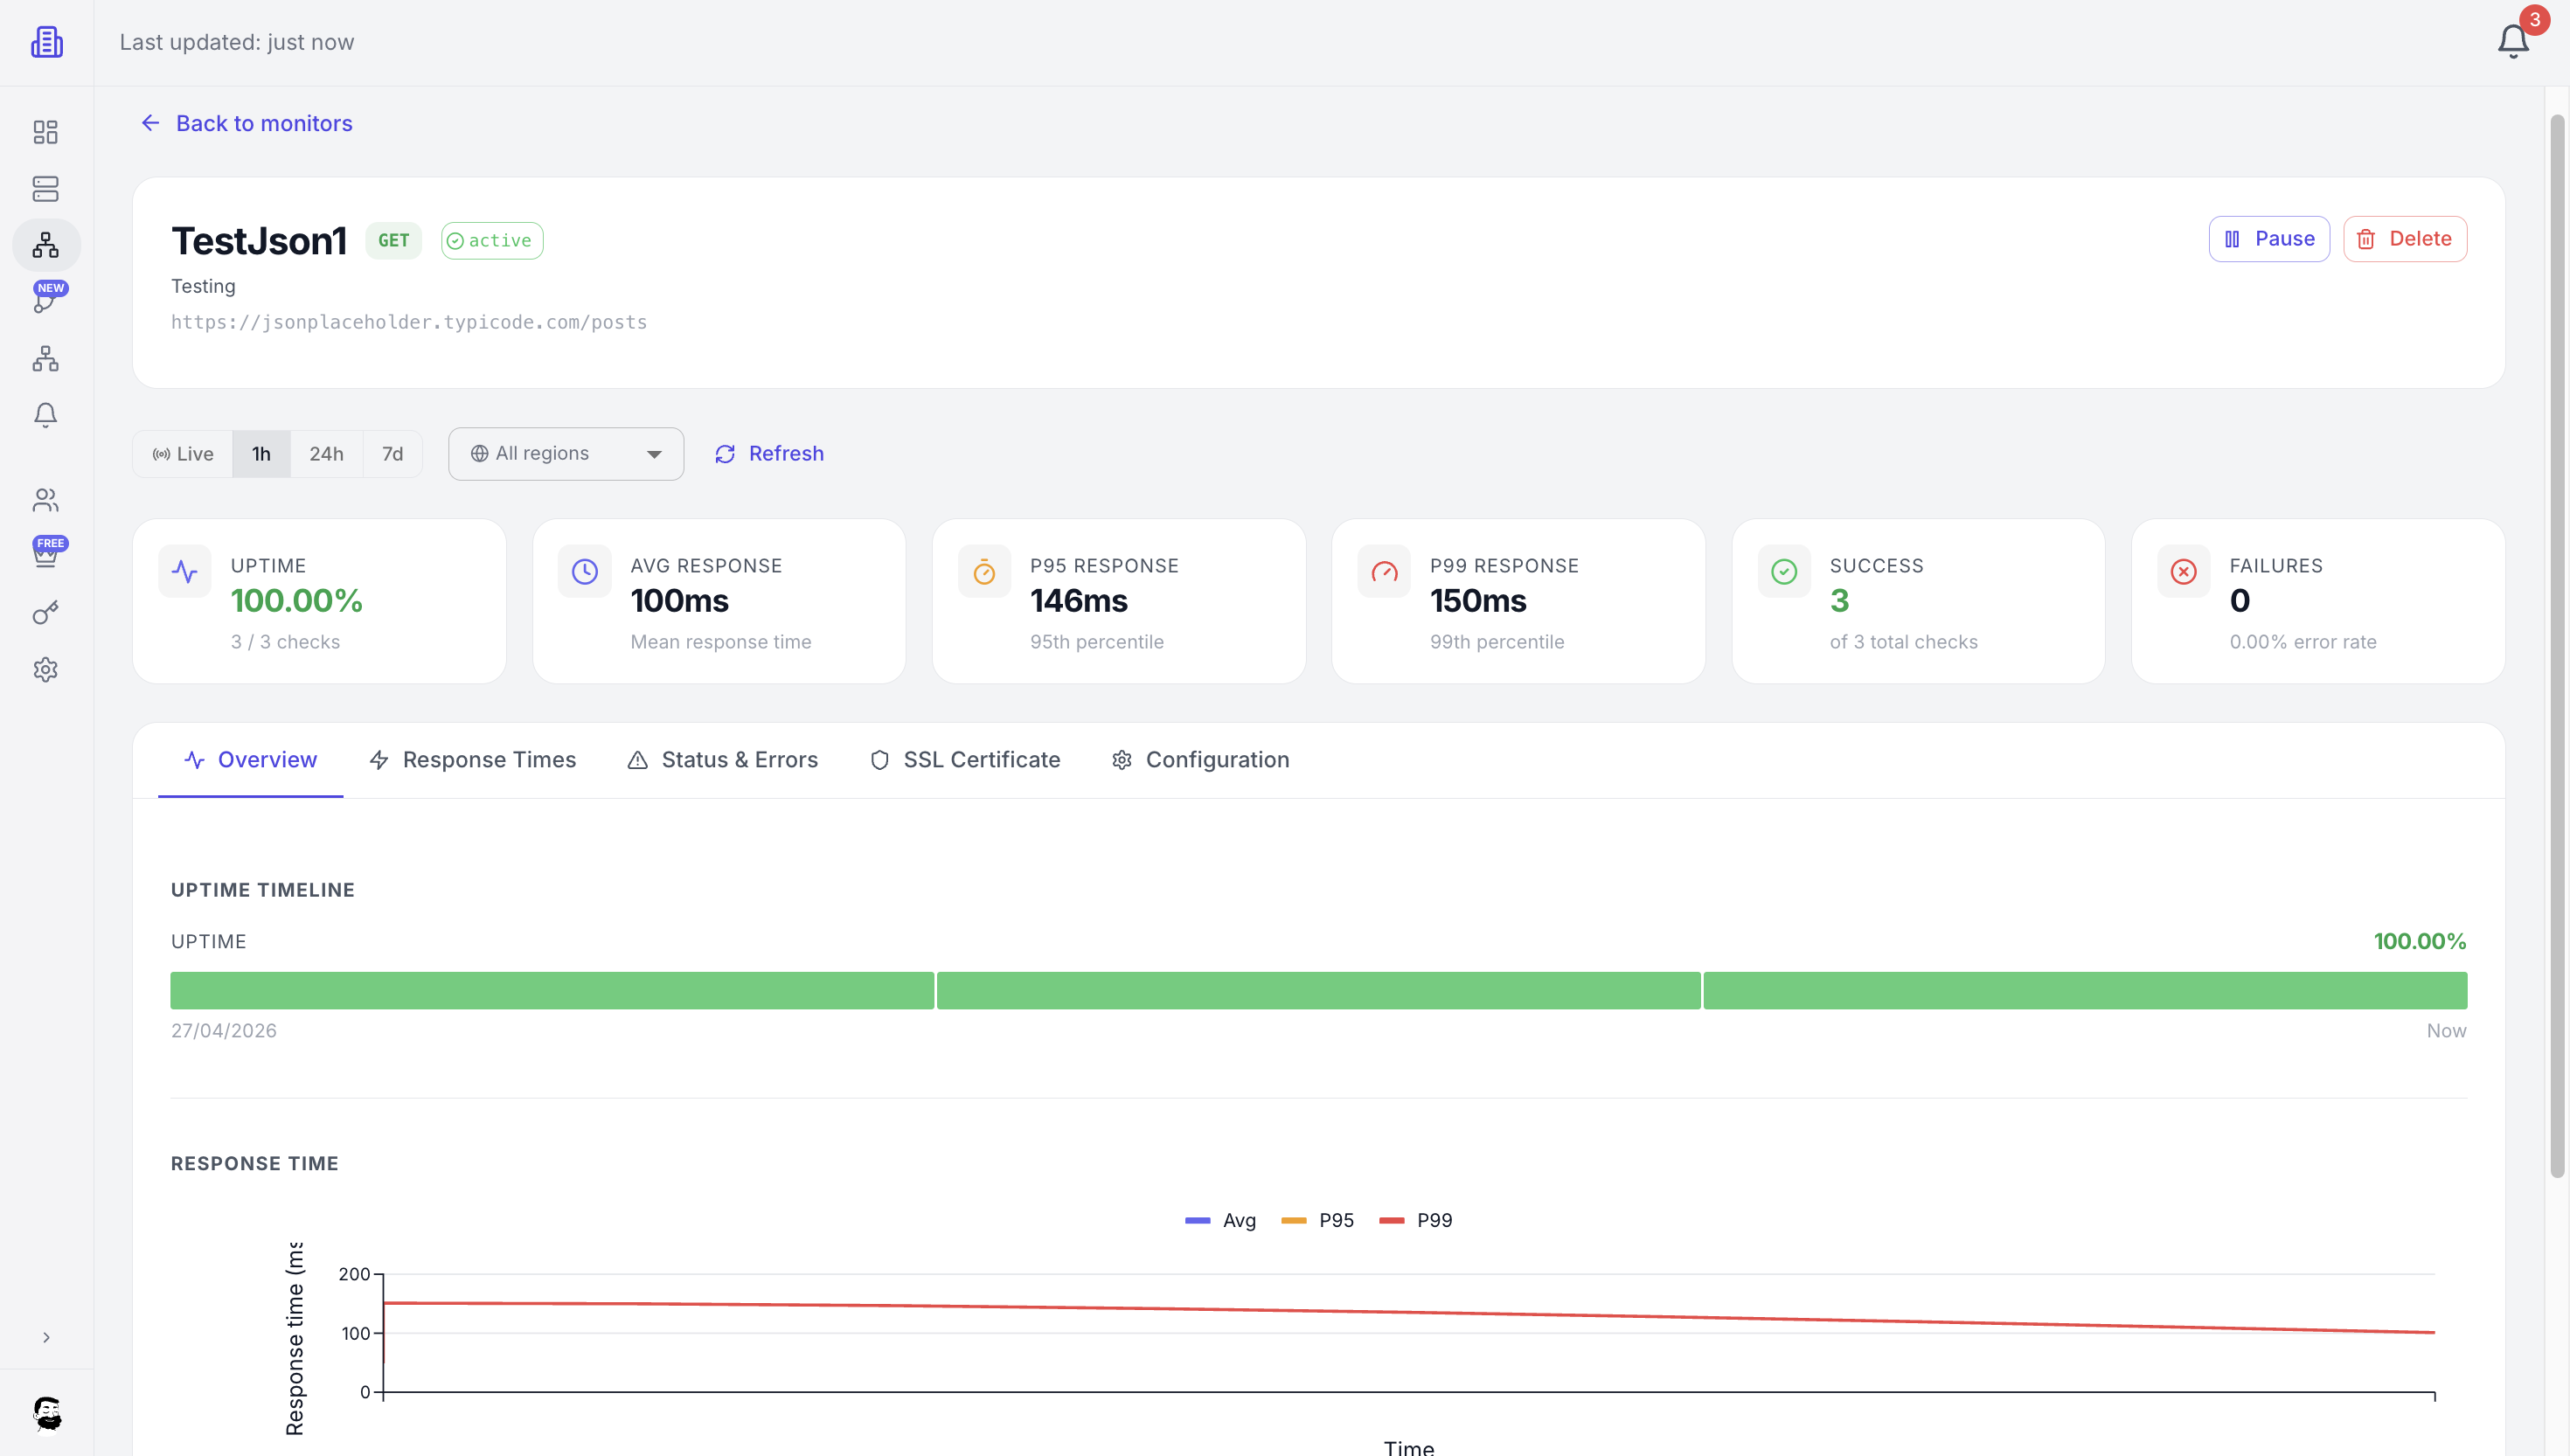
Find slow endpoints before your customers do.
Multi-region synthetic checks with full timing breakdowns — DNS, TCP, TLS, server, transfer. Catch regional degradations and SSL expiries early.
- ✓Real-time uptime and p50 / p95 / p99 latency, per region
- ✓Status, response body, and SSL certificate validation
- ✓Configurable intervals, retries, and degradation thresholds
- ✓Alert on first failure or after N consecutive failures
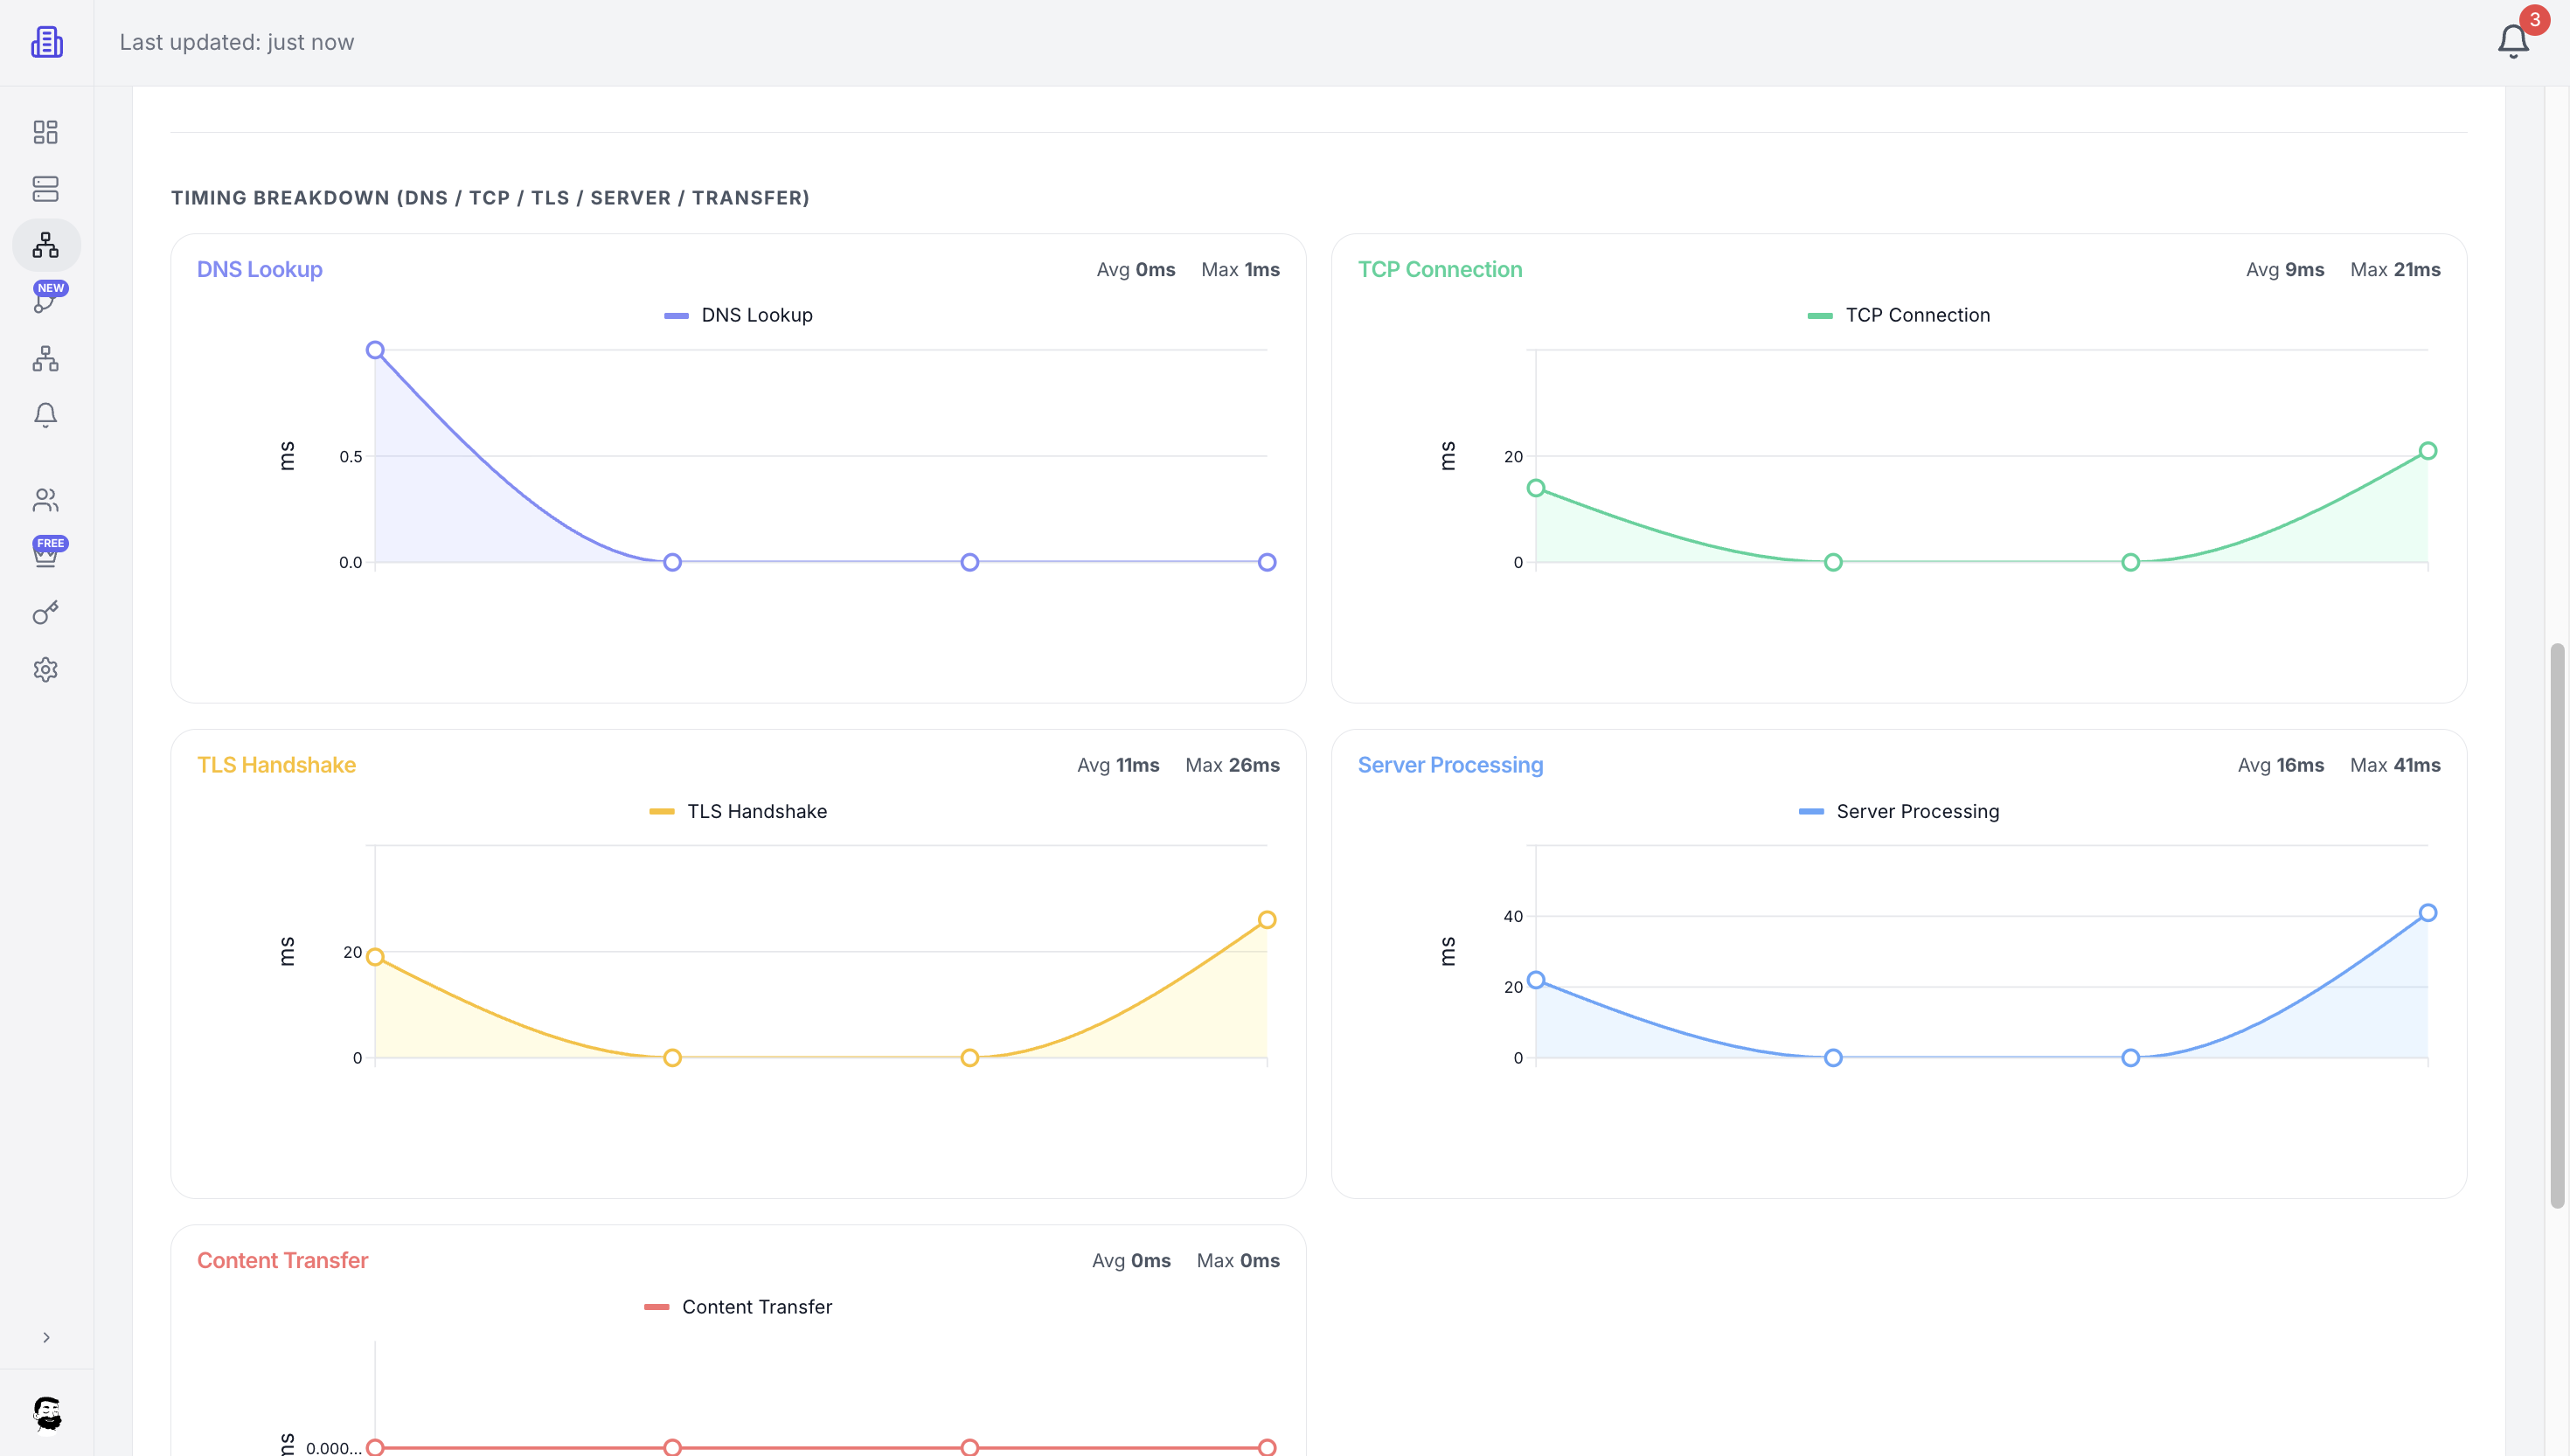
Know where the latency lives.
Every check decomposes into DNS, TCP, TLS handshake, server processing, and content transfer — so you can tell the CDN from the database.
- ✓Per-phase Avg and Max for the last 1h / 24h / 7d
- ✓Compare regions side-by-side
- ✓Pinpoint TLS handshake regressions and DNS flakiness
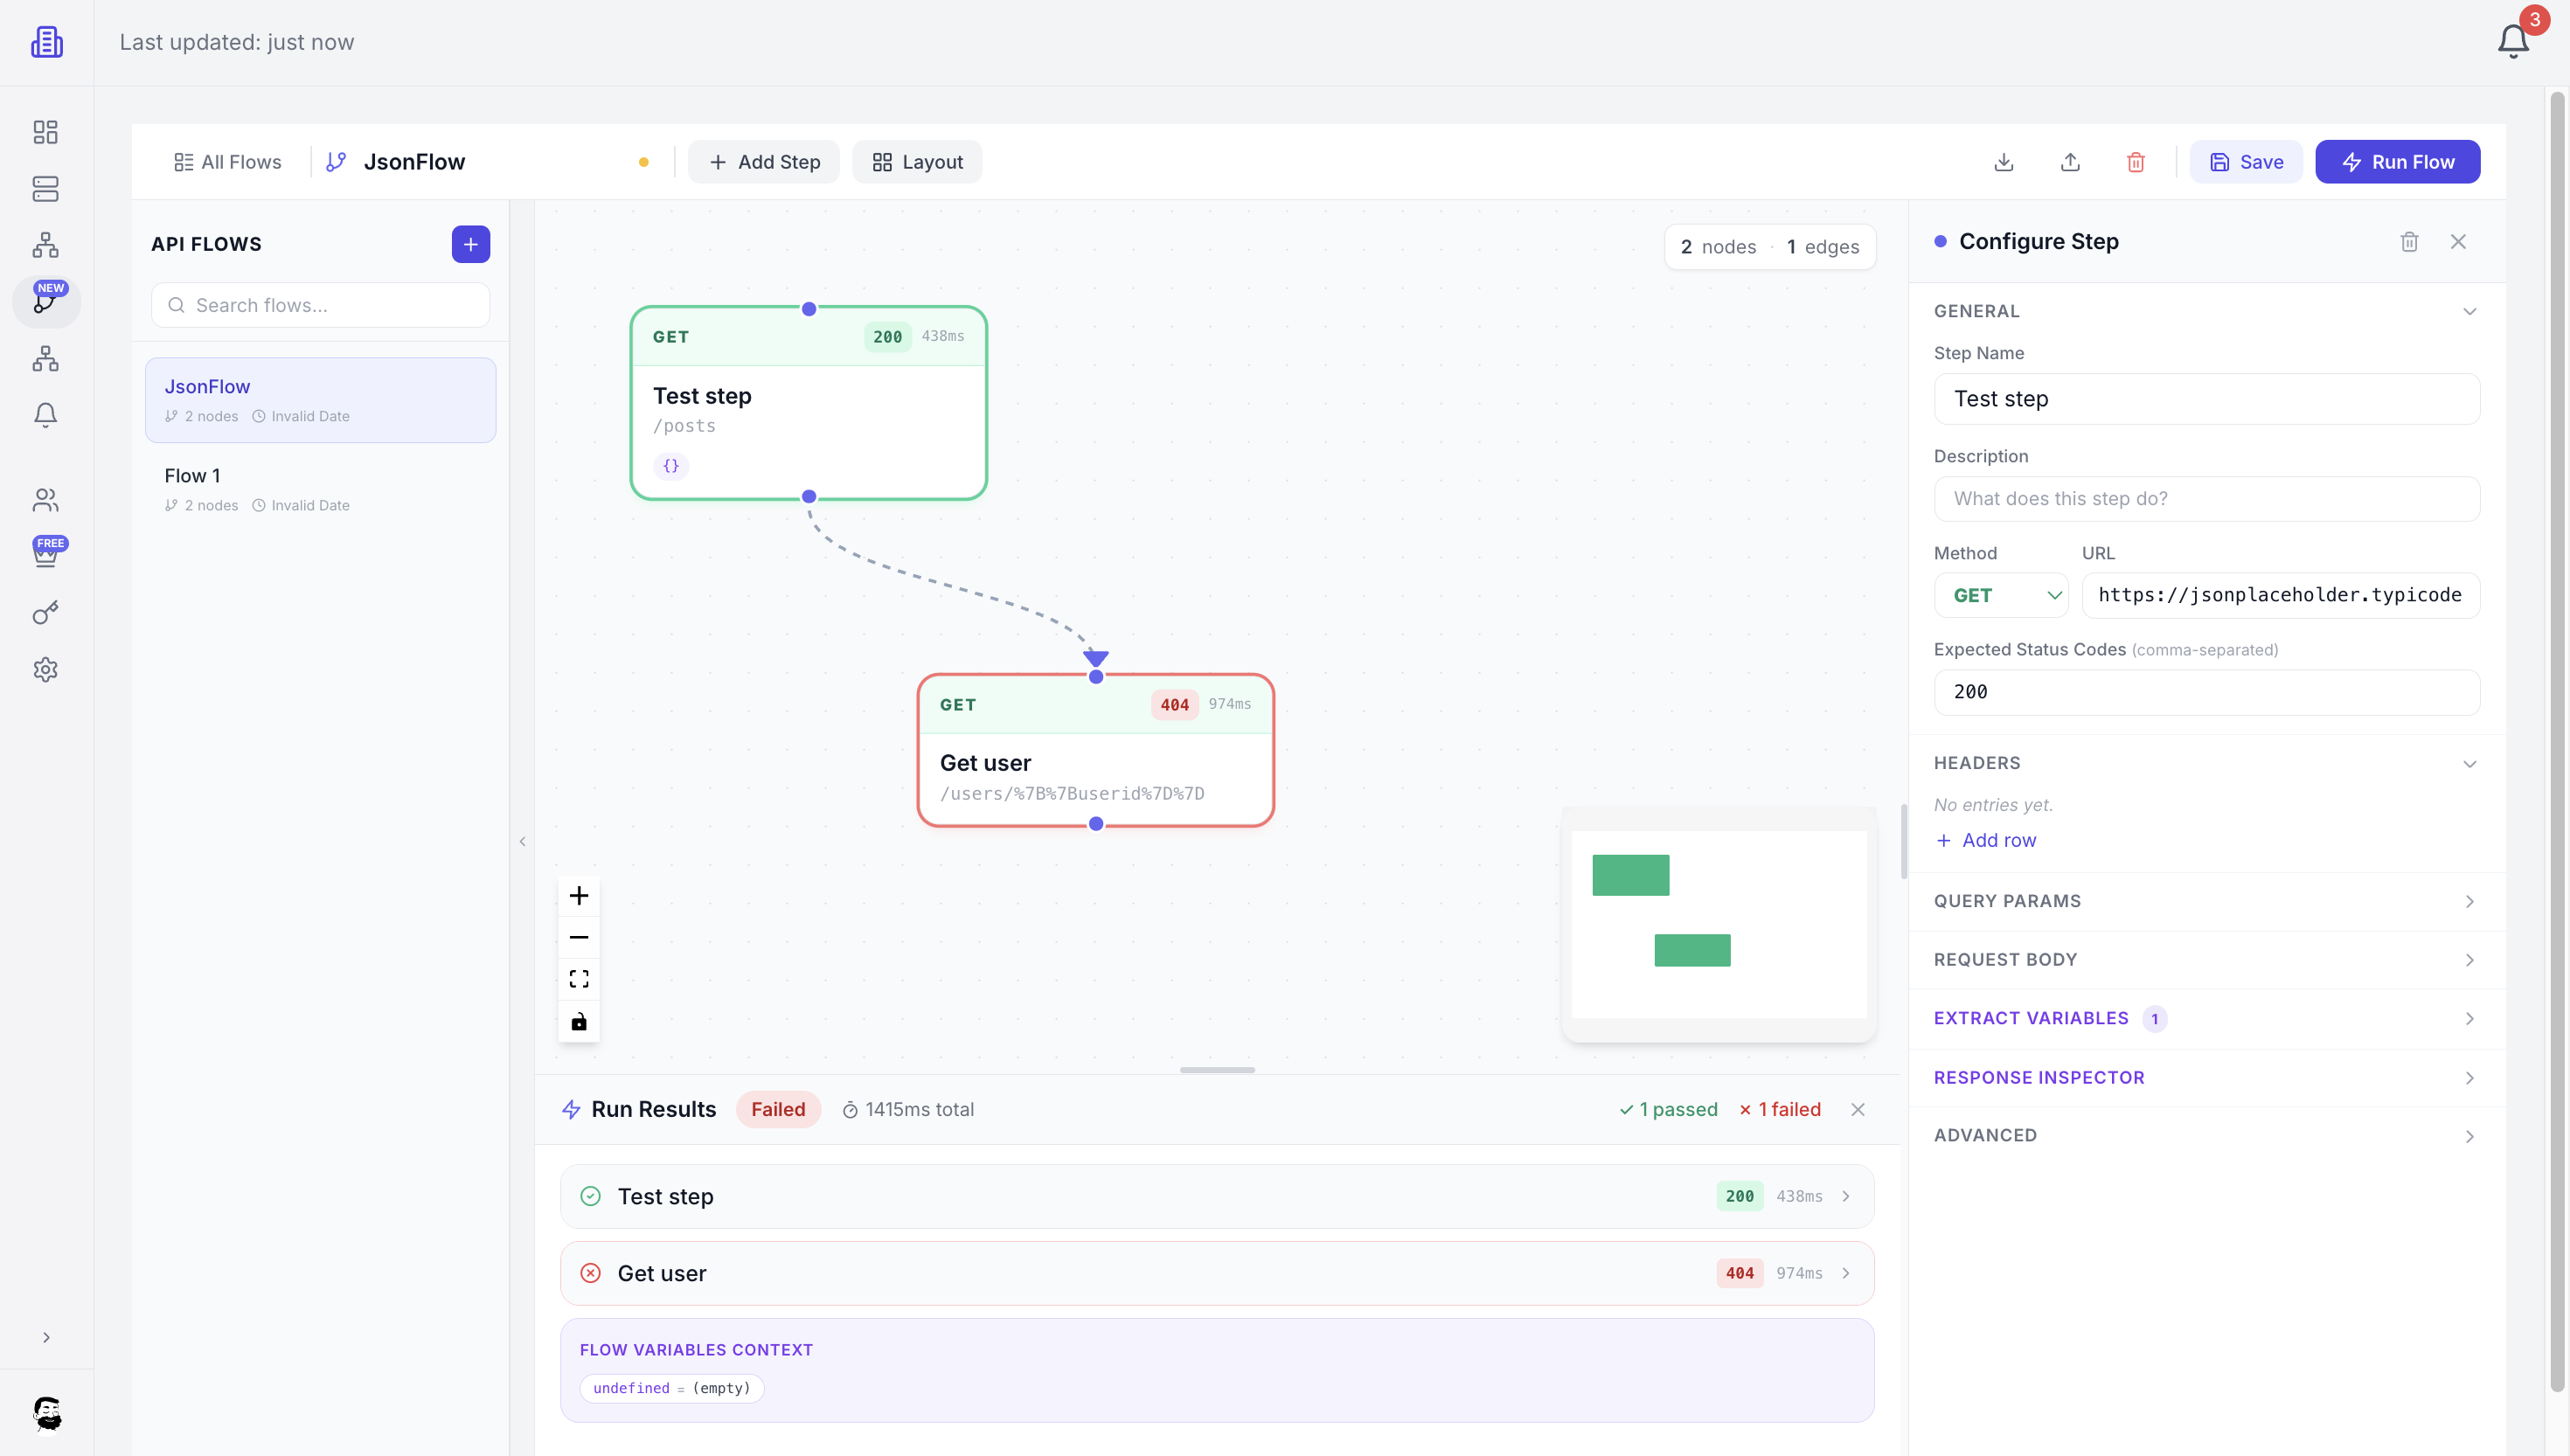
Test the journey, not just the endpoint.
Chain multi-step API flows — login, fetch, mutate, verify — with extracted variables and per-step assertions. Replay them on a schedule.
- ✓Visual canvas with drag-to-connect steps
- ✓Headers, query params, body, and response inspectors
- ✓Variable extraction for stateful test chains
- ✓Run on demand or on a schedule, alert on regressions
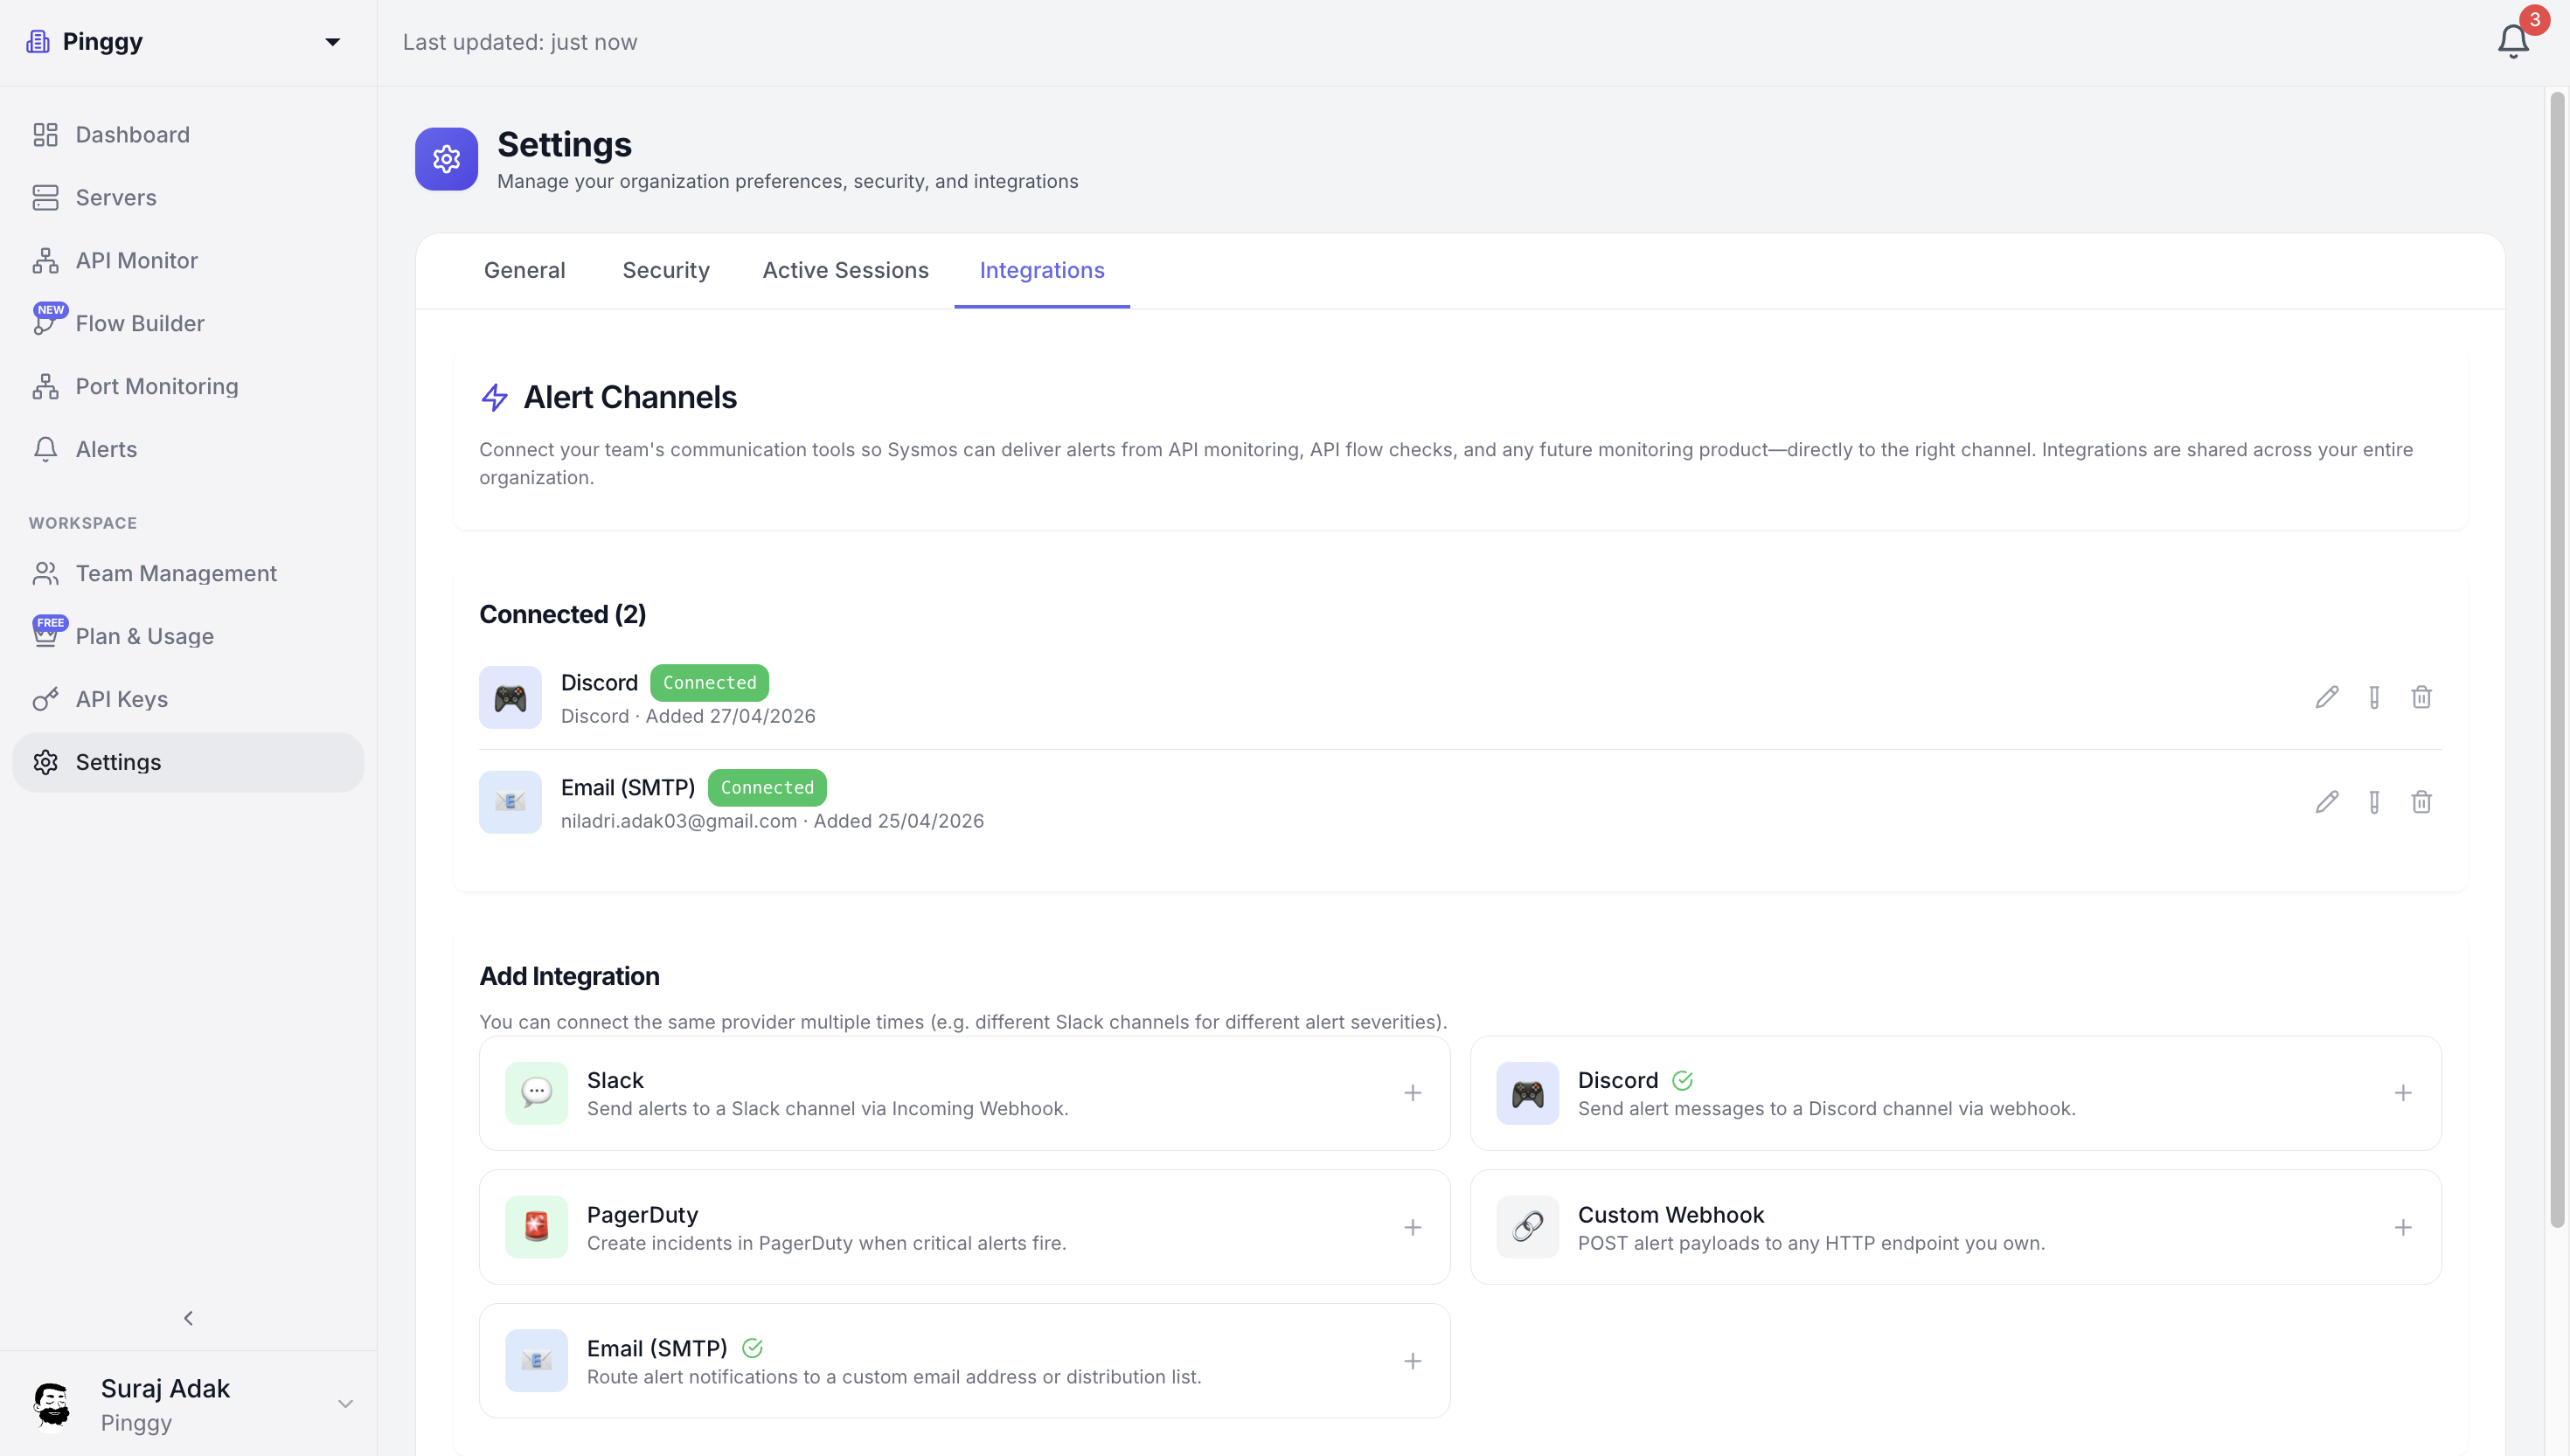
Alerts where your team actually is.
Connect Slack, Discord, PagerDuty, email, or any HTTP endpoint via webhook. Multiple instances of the same provider — one Slack channel for warns, another for criticals.
- ✓Five built-in channel types, plus generic webhooks
- ✓Severity-based routing and quiet hours
- ✓Connection health visible at a glance
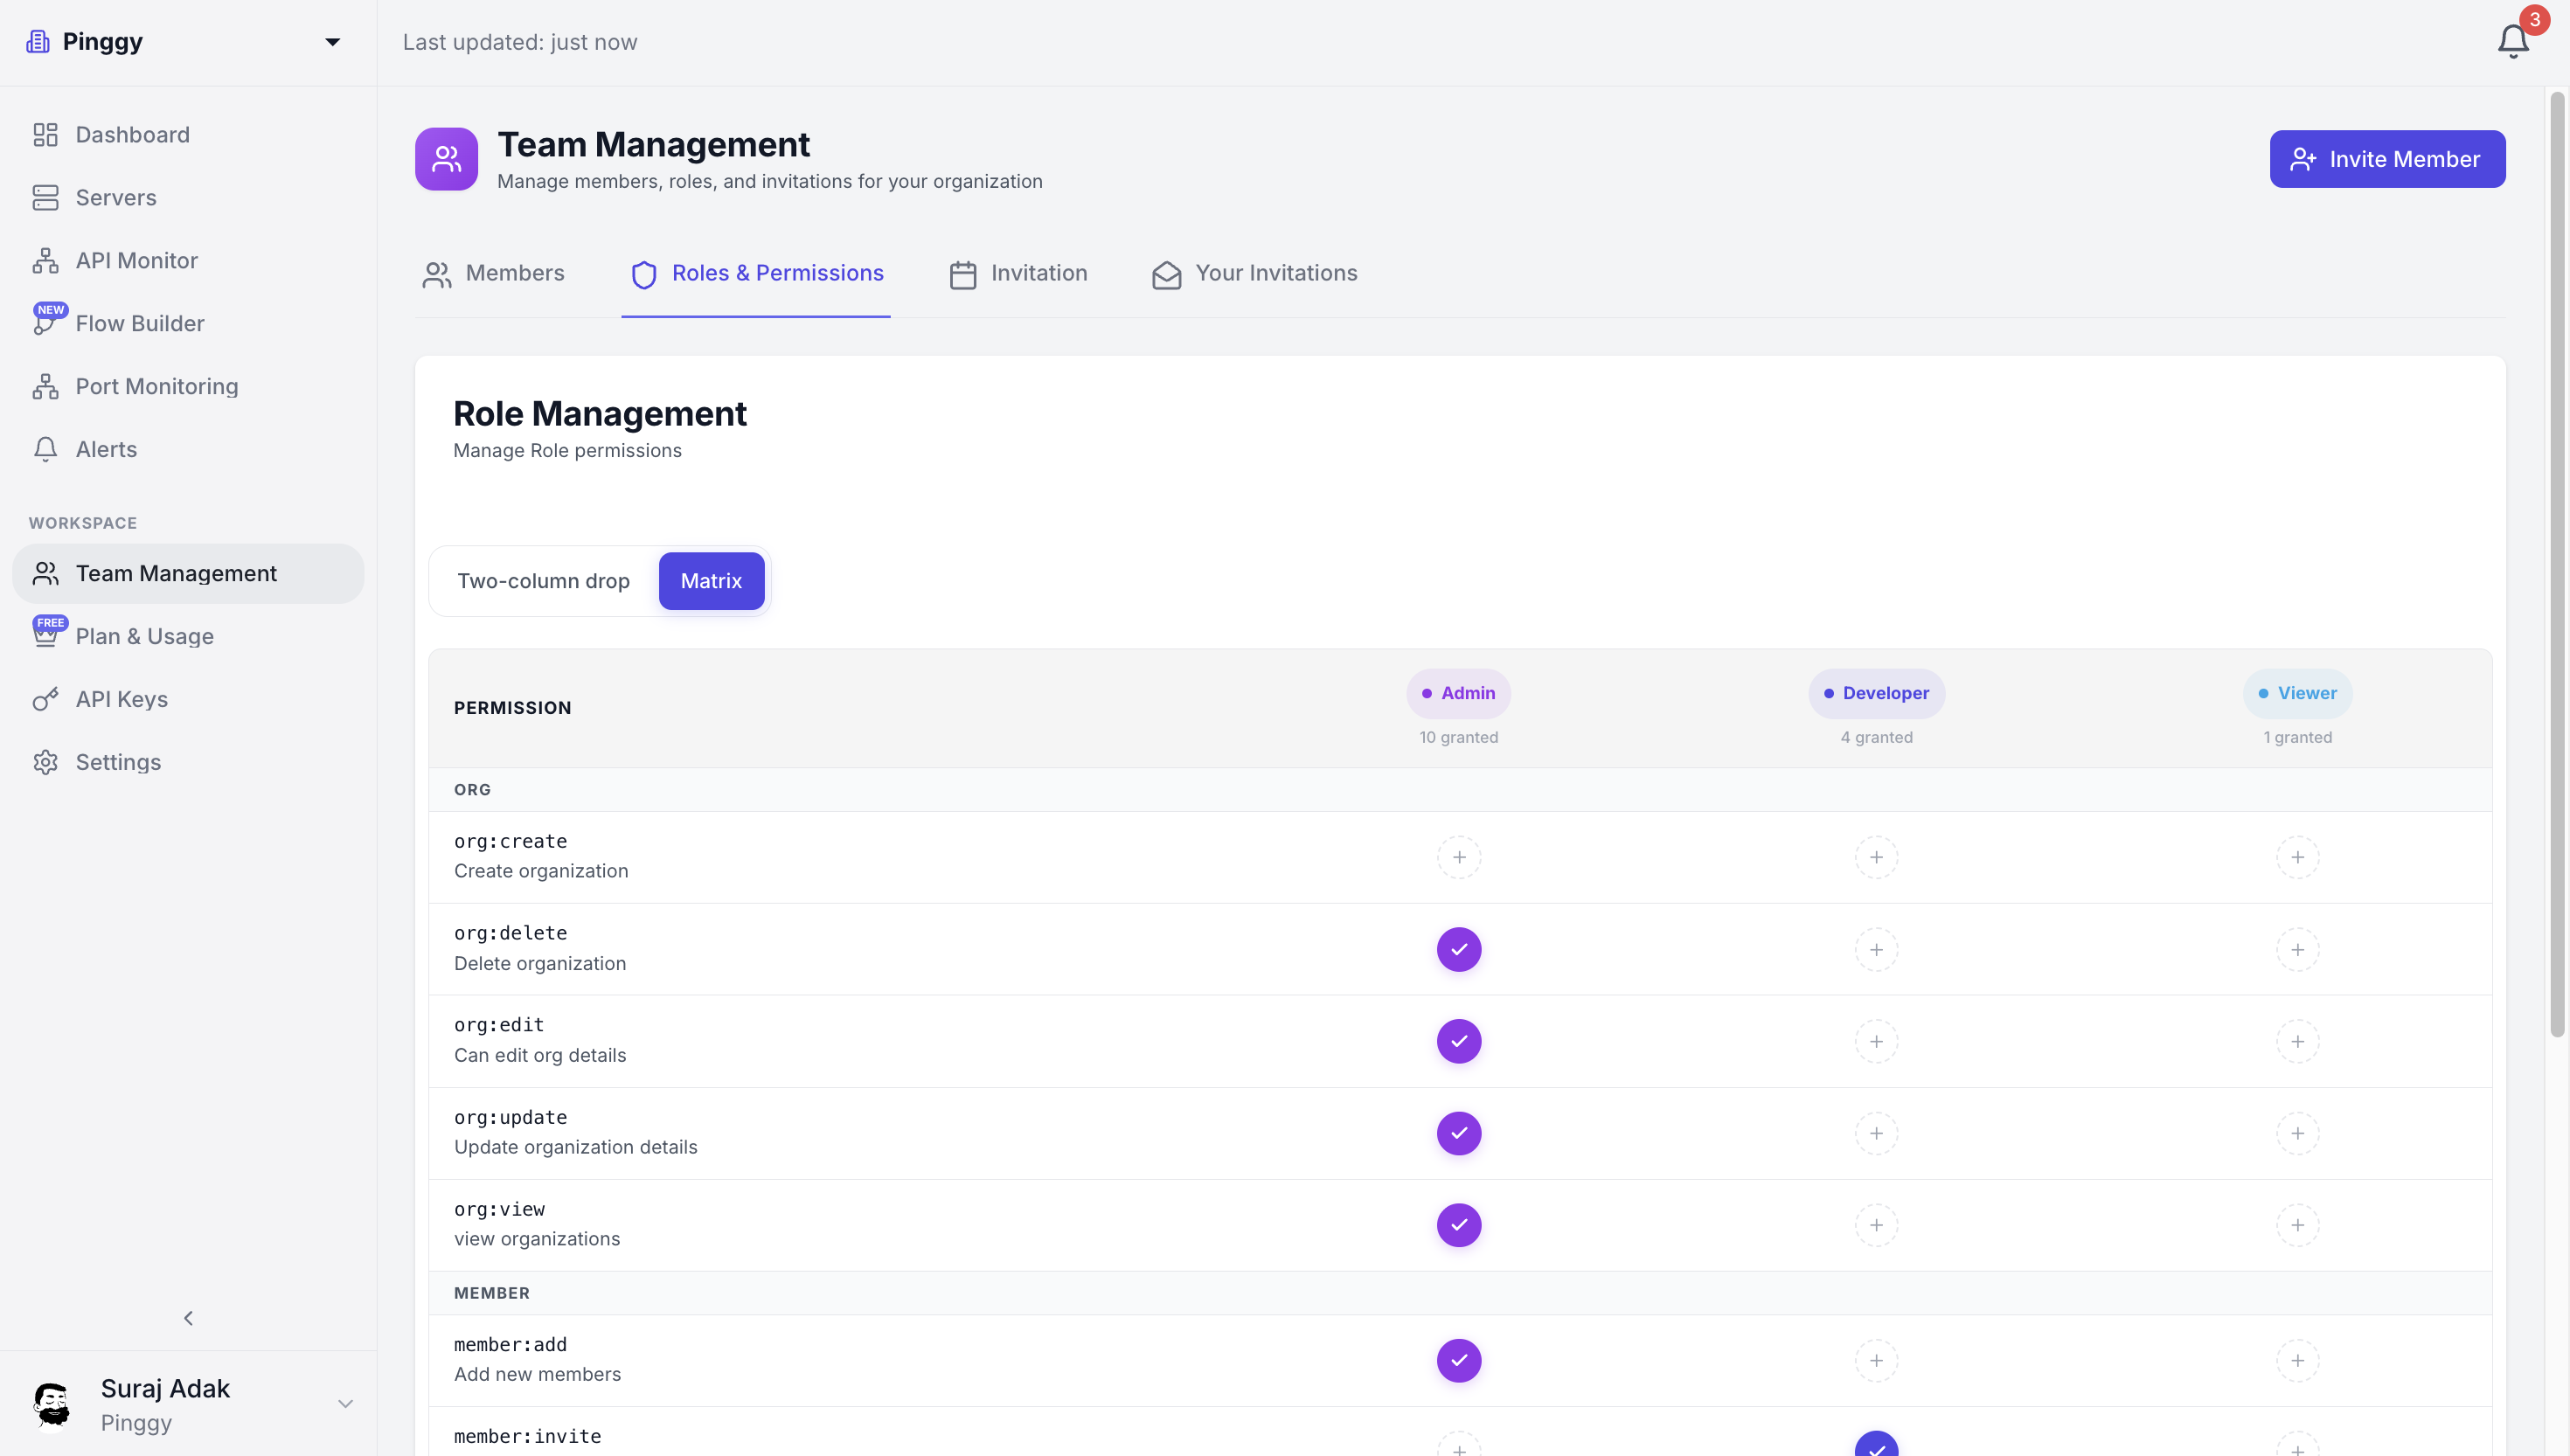
A workspace built for small teams.
Invite teammates, scope access with admin / developer / viewer roles, track quotas across organizations — all in the same dashboard.
- ✓Role-based permissions matrix
- ✓Per-organization usage and limits
- ✓API keys for CI / CD and infra-as-code
Plugs into the tools your team already uses.
Same provider can be connected multiple times — fan out severities to different Slack channels, route critical incidents to PagerDuty, ping a custom webhook for everything else.
Honest pricing for honest infrastructure.
Start free. Scale when you need to. No "contact sales" walls until you actually want them.
Free
Perfect for solo developers and personal projects.
- ✓10 API monitors · 5 flows
- ✓1 region · 60s min interval
- ✓5 team members · 1 organization
- ✓7-day log retention
Team
For startups running real production workloads.
- ✓100 monitors · 50 flows
- ✓All 12 regions · 30s interval
- ✓Unlimited members · 5 orgs
- ✓30-day retention · all integrations
- ✓Server agent included
Business
For small enterprises with strict SLAs.
- ✓Unlimited monitors and flows
- ✓10s interval · custom regions
- ✓SSO · audit logs · SLA
- ✓1-year retention
- ✓Priority support
Stop guessing why production is slow.
Ship Sysmos to your stack today and have your first multi-region check, server agent, and Slack alert running before standup.